Toen Effio de zogenaamde Warming Stripes onder ogen kwam van klimaatwetenschapper Ed Hawkins, was het direct duidelijk: deze roodblauwe kleurcodes moeten we vertalen naar een stijlvolle sok. Op basis van de kleurcodes van Ed Hawkins hebben we ook vier andere kleurcodes ontwikkeld die respectievelijk neerslagpatronen, bodemleven, biodiversiteit en CO2 uitstoot in Nederland duiden. We weten natuurlijk dat deze klimaatgerelateerde issues niet één op één samenhangen. Maar we weten ook dat er wel degelijk een samenhang. Kijk maar mee.
Warming Stripes Rain
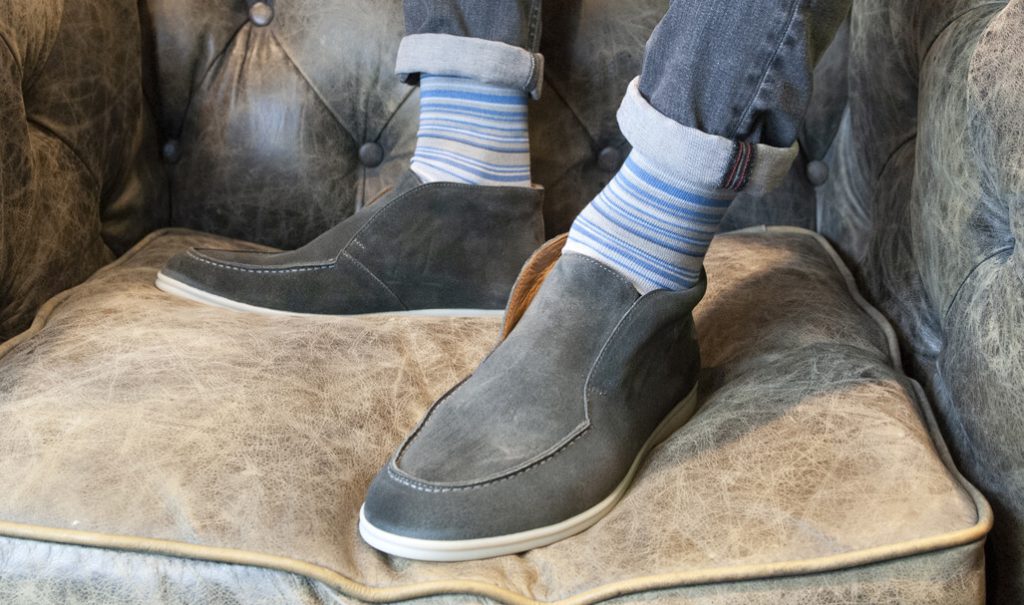
De Warming Stripes Rain laten in één oogopslag de neerslagpatronen in Nederland zien sinds 1901. Aan de hand van temperatuurvariaties, zoals door klimaatwetenschapper Ed Hawkins verbeeld in de Warming Stripes, is de grilligheid van de neerslag geduid. Hoe donkerder het blauw hoe grilliger de neerslag met steeds meer extreem droge en natte periodes. Het patroon laat zien dat de neerslagpatronen de laatste decennia steeds grilliger worden.
Wordt de neerslag grilliger?
Dit beeld correspondeert met Europese waarnemingen sinds midden 20e eeuw. Deze laten een duidelijke trend zien in het optreden van extreme weersomstandigheden. Het aandeel neerslag dat valt in de meest extreme categorie neemt significant toe. Het KNMI geeft aan dat ‘de mate van mondiale opwarming het regionale klimaat, en het voorkomen van extremen op Nederlands grondgebied duidelijk beïnvloedt’. Voor Nederland geldt dat de gemiddelde en extreme neerslag in de winter toeneemt. In de zomer neemt de intensiteit van extreme regenbuien toe en worden hagel en onweer heviger.
Dus ja: het klopt dat de Warming Stripes Rain naar boven toe steeds donkerderblauw kleurt. De neerslag wordt steeds grilliger en extremer.
Warming Stripes Soil Life
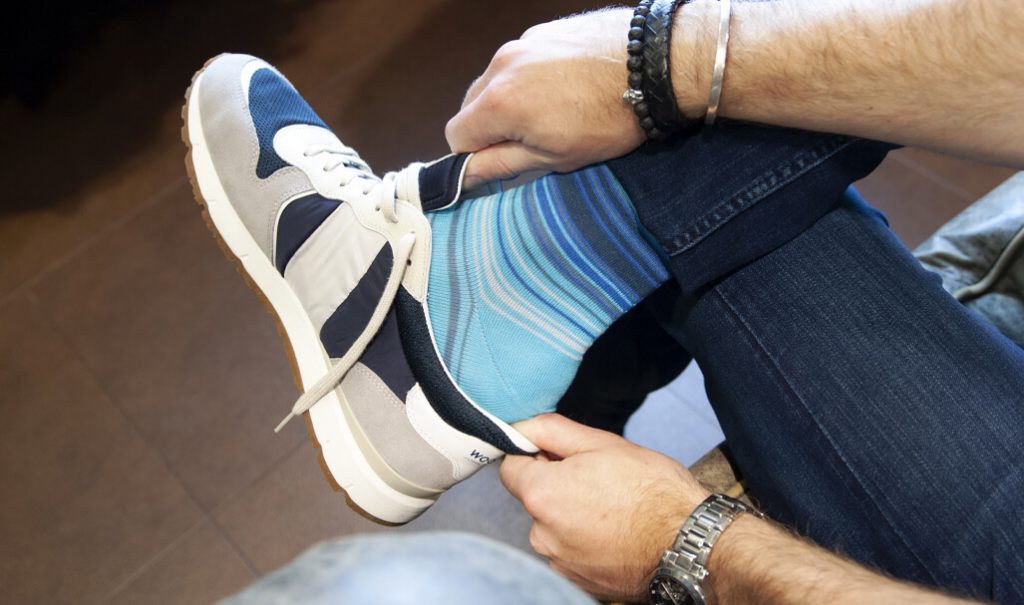
De Warming Stripes Soil Life laten in één oogopslag de rijkdom van het bodemleven in Nederland zien sinds 1901. Aan de hand van temperatuurvariaties zoals door klimaatwetenschapper Ed Hawkins verbeeld in de Warming Stripes, is de rijkdom (of armoede) van het bodemleven geduid. Hoe meer oranje, hoe armer. Het patroon laat zien dat het bodemleven de laatste decennia steeds armer wordt.
Neemt de bodemrijkdom af?
Het onderzoek naar effecten van klimaatverandering op bodem is vooral gericht op organische stof in de bodem. Logisch omdat organische stof in de bodem het merendeel van de bodemfuncties stuurt. Verschillende studies laten zien dat klimaatverandering leidt tot snellere afbraak en verlies van organische stof in de bodem. Dat is niet best want deze afname kan leiden tot een afname van biologische activiteit en bodemvruchtbaarheid.
Dus ja: het klopt dat deze Warming Stripes Soil life naar boven toe steeds meer oranje kleurt. De afname van organische stof in de bodem leidt tot een afname van het bodemleven. Maar er is een kanttekening. Verschillende studies laten zien dat menselijke activiteiten als het bemesten, afdekken en omspitten van de bodem van grotere invloed zijn op de bodemgesteldheid dan de verwachte invloed van klimaatverandering op de voorraad organische stof in de bodem. Dus: denk vooral eerst goed na voordat je ingrijpt in het complexe bodem- en watersysteem.
Warming Stripes Biodiversity
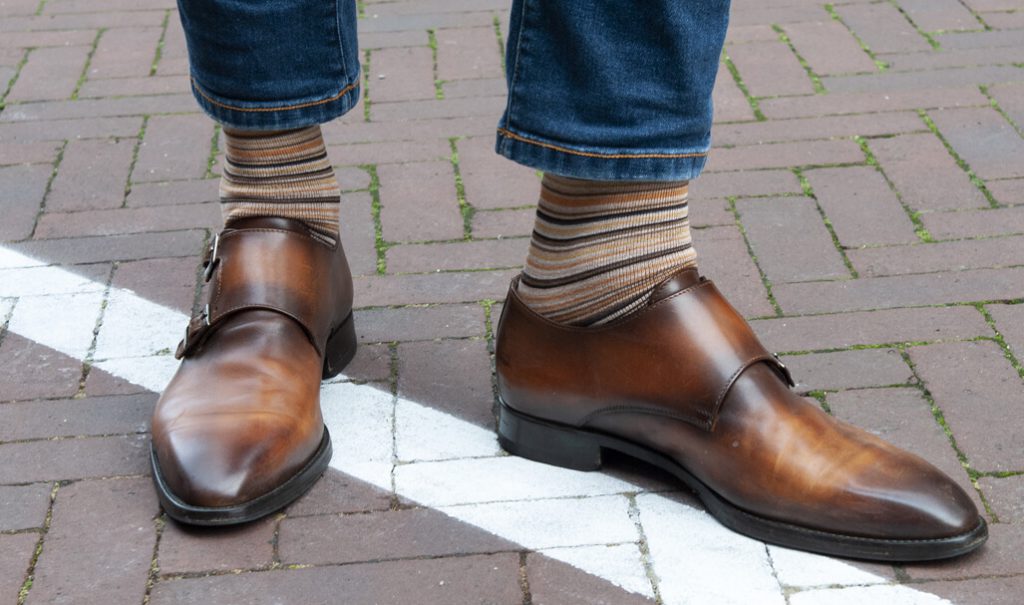
De Warming Stripes Biodiversity laten in één oogopslag de rijkdom aan biodiversiteit in Nederland zien sinds 1901. Aan de hand van temperatuurvariaties is de rijkdom (of armoede) van biodiversiteit geduid. Hoe paarser, hoe eenzijdiger. Het patroon laat zien dat de biodiversiteit de laatste decennia steeds armer wordt.
Neemt de biodiversiteit af?
De exacte invloed van klimaatverandering op de natuur is moeilijk te bepalen omdat er gelijktijdig veel andere bedreigingen zijn, zoals de vernietiging van natuurgebieden door ontbossing en overbevissing en de blootstelling aan gif en meststoffen uit de landbouw. De VN concludeert dat door alle bedreigingen samen zo’n miljoen soorten met uitsterven worden bedreigd. Ook in Nederland gaat het met veel dier- en plantensoorten zeer slecht. Er is zelfs geen land in Europa dat het slechter doet als het om de instandhouding van zogeheten natuurlijke habitattypen gaat. Als de temperatuur 3 graden stijgt zal het rond 2080 voor 40 procent van onze plantensoorten te warm zijn om te overleven.
Dus ja: het klopt dat deze Warming Stripes Biodiversity naar boven toe steeds meer paars kleurt. Dit betreft de afname van de natuurlijke habitattypen in Nederland. Dit wordt niet alleen veroorzaakt door klimaatverandering maar ook door andere bedreigingen als bemesting, vervuiling en versnippering van natuurgebieden in Nederland.
Warming Stripes Emissions
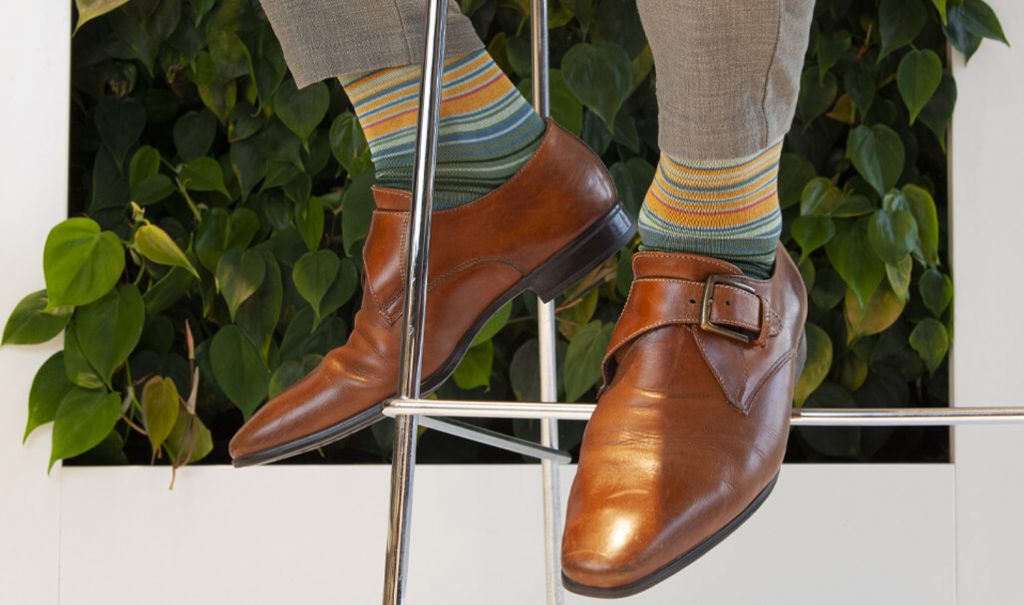
De Warming Stripes Emissions laten in één oogopslag de CO2 uitstootin Nederland zien sinds 1901. Aan de hand van temperatuurvariaties is de uitstoot geduid. Hoe donkerder, hoe meer uitstoot. De sok wordt naar boven toe steeds donkerder en geeft aan dat we steeds meer uitstoren…
Stoten we meer CO2 uit?
Veel onderzoeken stellen dat tot aan 1950 natuurlijke invloeden belangrijker waren dan de menselijke invloeden op het klimaat. Volgens het IPCC is het zeer waarschijnlijk (meer dan 90 procent kans) dat het grootste deel van de opwarming van de aarde in de afgelopen decennia is toe te schrijven aan de waargenomen toename van broeikasgassen. Het meest bekende en belangrijkste broeikasgas is CO2. Dit broeikasgas komt in grote hoeveelheden vrij bij de verbranding van fossiele brandstoffen. De huidige concentratie in de lucht is in geen 800.000 jaar zo hoog is geweest als nu. Nederland staat, per hoofd van de bevolking, hoog op de ranglijst van grootste CO2-uitstoters ter wereld.
Dus ja: het klopt dat deze Warming Stripes Emissions naar boven toe steeds donkerder kleurt. De recente opwarming is het gevolg van de toegenomen CO2-concentratie en Nederland is één van de grootste CO2-uitstoters ter wereld.